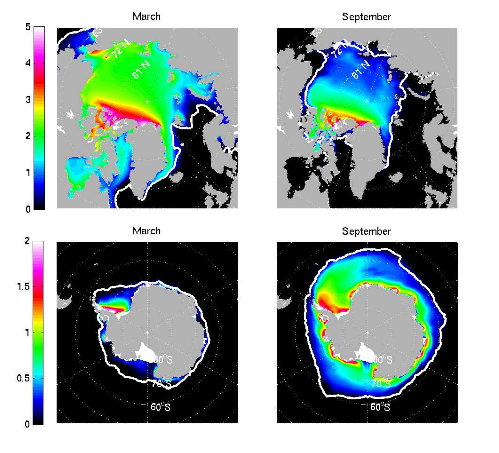
 Work by Martin Losch of the Alfred-Wegener-Institute, Bremerhaven, Germany, Jean Michel Campin, Patrick Heimbach, Chris Hill (at MIT) and Dimitris Menemenlis (JPL) extending the reach of the MITgcm in to the Polar oceans, with the development of a dynamic-thermodynamic sea-ice model and its adjoint...
 Work by Martin Losch of the Alfred-Wegener-Institute, Bremerhaven, Germany, Jean Michel Campin, Patrick Heimbach, Chris Hill (at MIT) and Dimitris Menemenlis (JPL) extending the reach of the MITgcm in to the Polar oceans, with the development of a dynamic-thermodynamic sea-ice model and its adjoint...


